DataDog is a great service for monitoring all your services running on your servers. You typically use it by setting up the DataDog Agent on all your servers and configuring it with what applications/integrations you want it to run checks on. What about external services that do not run on your servers like a managed MySQL or RabbitMQ?

We were previously using our managed provider’s push based DataDog integration but this had a 2 minute 30 second delay in metrics which made scaling due to RabbitMQ metrics difficult to use.
This post goes specifically into how to setup a Cluster Check for a RabbitMQ service including the Terraform code and Kubernetes YAML to automate the process.
Typically you could also configure your agents to check them to in the same manner. If you run a lot of servers, maybe 10-100+, and on Kubernetes you probably want to take advantage of the DataDog Cluster Agent which does exactly what it’s called.
See this blog post for more information on how the Cluster Agent works, but basically it eases the load on your K8s API Server and enables a host of new features like External Metrics for Horizontal Pod Autoscalers (HPAs) and Cluster Checks.
Our goal here was to monitor our externally hosted RabbitMQ clusters from a DataDog RabbitMQ Integration Check, to enable us to have near real time RabbitMQ metrics in order for us to take advantage of the External Metrics for HPAs.
Setup the DataDog Cluster Agent
We won’t go into the entire setup of the DataDog Cluster Agent on Kubernetes, to say the least it’s a bit detailed.
I will recommend you use the DataDog Helm Chart and save your brain cells for more pressing problems.
A Helm Chart is package format for Kubernetes manifests/YAML that makes complex applications simpler to install.
helm install --name datadog-monitoring \
    --set datadog.apiKey=<DATADOG_API_KEY> \
    --set datadog.appKey=<DATADOG_APP_KEY> \
    --set clusterAgent.enabled=true \
    --set clusterAgent.metricsProvider.enabled=true \
    --set clusterAgent.token=<GENERATE_A_SECRET> \
    stable/datadog
For saner configuration, transfer all these configuration into your own Helm
datadog-values.yamlfile. See the default values.yaml for what each configuration key is for.
The clusterAgent.token value is a secret that is used to communicate between the regular DataDog agents on each host and the Cluster Agent. Be sure to generate this using whatever random string generator you have and treat it like a secret.
Typically the Cluster Agent is setup with the External Metrics Provider server, so we enabled that also in order for us to be able to use external metrics in our HPA (Horizontal Pod Autoscaler) objects.
Create a DataDog user for RabbitMQ
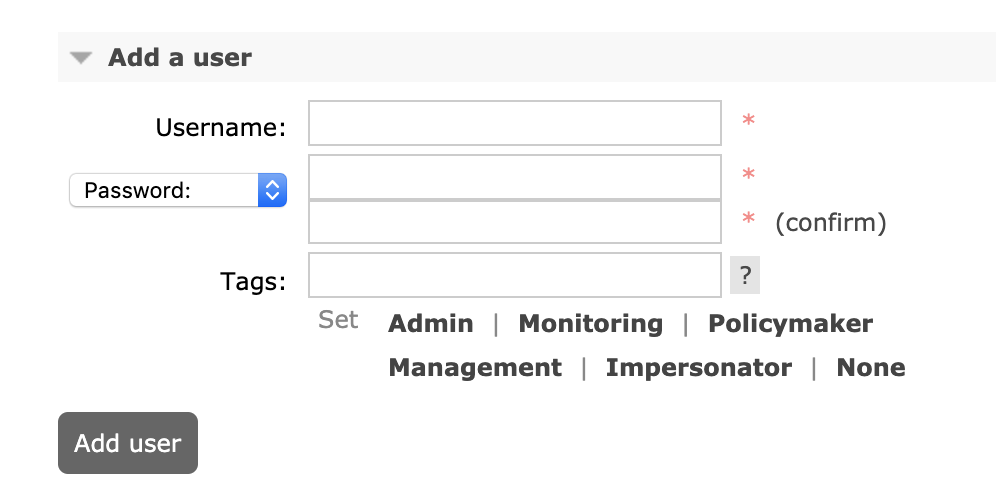
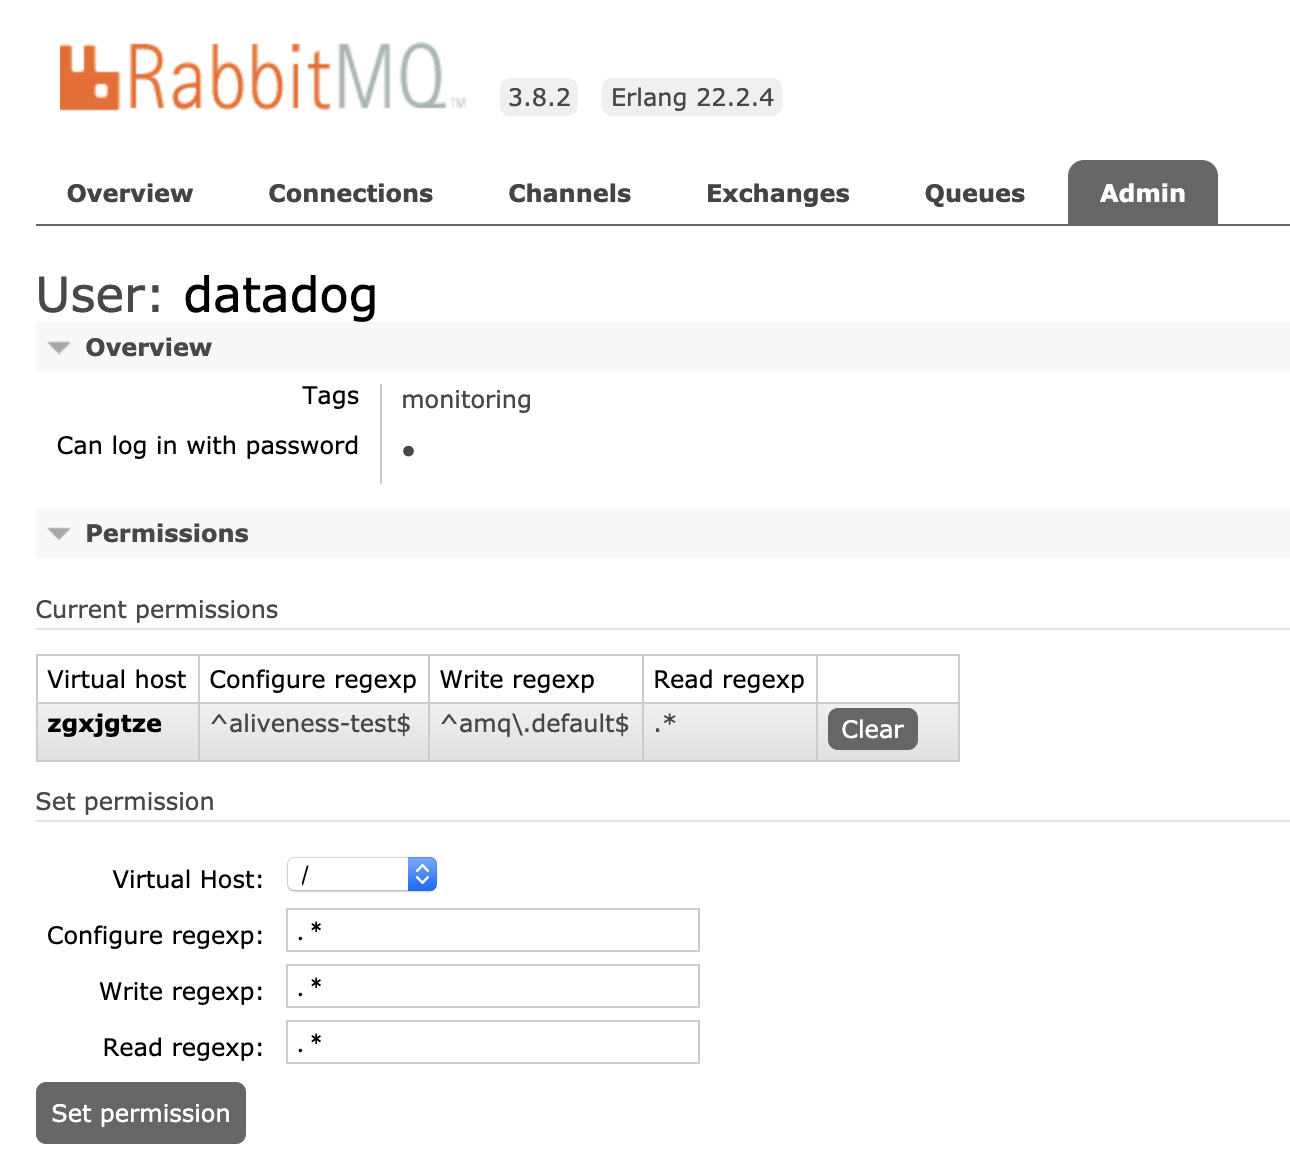
In order for DataDog to monitor RabbitMQ and extract its metrics, a user needs to be created and given permissions in the virtual hosts that you want tracked.
RabbitMQ Virtual Hosts are a concept that allow many different services to run on the same host without running into conflicts. Typically a single service will connect to its own virtual host which is not shared with other applications.


Using Terraform:
User creation is usually done from the standard RabbitMQ Management Plugin but doing this for many clusters can get tedious so we will use Terraform which has a great RabbitMQ provider.
# main.tf

# Configure this provider to connect to your RabbitMQ API Server
provider "rabbitmq" {
  # URL of your RabbitMQ Server without the /api path
  endpoint = "https://your-rabbit-mq-server"
  # Username / Password of a user that has the 'administrator' tag
  # See https://www.rabbitmq.com/management.html#permissions
  username = "admin"
  # Don't store passwords in plain text. Use a "aws_kms_secrets" resource etc.
  # Suggested Article:
  #  https://www.linode.com/docs/applications/configuration-management/terraform/secrets-management-with-terraform/
  password = "STORE_THIS_IN_A_SECRET"
}
Now lets create the user and assign it permissions for the virtual hosts we want:
# users.tf

# rabbitmq_user.users creates a 'datadog' user with password and tags
resource "rabbitmq_user" "users" {
  name     = "datadog"
  password = "DATADOG_RABBITMQ_PASSWORD"
  tags     = ["monitoring"]
}

# rabbitmq_permissions.permissions assigns permissions
# in a specific Virutal Host for the 'datadog' user
resource "rabbitmq_permissions" "permissions" {
  # Make this resource depend on the users resource
  # so it doesn't get created or deleted before the users
  depends_on = [
    rabbitmq_user.users
  ]

  user  = "datadog"
  # If using a specific virtual host, set here:
  vhost = "/"

  # Permissions required by DataDog
  # https://docs.datadoghq.com/integrations/rabbitmq/#prepare-rabbitmq
  permissions {
    configure = "^aliveness-test$"
    # terraform doesnt like strings with \. so we have to use Heredoc syntax...
    write     = <<EOT
^amq\.default$
EOT
    read      = ".*"
  }
}
Usually you would want to encapsulate this into a module and perhaps use the new
for_eachsyntax to manage multiple users in your RabbitMQ instance.
Configure DataDog Cluster Check
We must now configure our DataDog Cluster Agent with a Cluster Check for RabbitMQ.
First we actually need to enable Cluster Checks on the agent. Again there is a lot of configuration steps to this process if you deploy DataDog in your own unique way.
For this example we are just going to use the Helm Chart values that we have available and put them into our own datadog-values.yaml file:
# datadog-values.yaml
clusterAgent:
  clusterChecks:
    # setting this true enables all the required Cluster Agent and Agent config
    enabled: true
Now we add in the configuration for our RabbitMQ check:
# datadog-values.yaml
clusterAgent:
  confd:
    # The DataDog Docker image creates a file /etc/datadog-agent/conf.d/rabbitmq.yaml
    # which the DataDog Cluster Agent will then use as its source of configuration
    rabbitmq.yaml: |-
      # See all available configuration keys:
      # https://github.com/DataDog/integrations-core/blob/master/rabbitmq/datadog_checks/rabbitmq/data/conf.yaml.example

      # Set this to true to indicate this is a cluster check
      cluster_check: true

      # init_config is required even if its empty
      init_config:

      # Specify the external RabbitMQ instances you want to collect metrics from
      instances:
      - rabbitmq_api_url: "https://your-rabbit-mq-server/api/"
        username: "datadog"
        password: "DATADOG_RABBITMQ_PASSWORD"
        # Cluster checks have no host so they will not inherit host tags set by the agent
        # You can also specify cluster agent wide tags in the DD_CLUSTER_CHECKS_EXTRA_TAGS env var
        tags:
        - "env:production"
You also generally do not want to store secrets in your Helm YAML, consider using a plugin like Helm Secrets which uses sops under the hood to encrypt values in YAML.
Now lets upgrade our DataDog Agent installation with our new cluster check:
helm upgrade \
    --name datadog-monitoring \
    -f ./datadog-values.yaml \
    stable/datadog
View Metrics in DataDog
If all goes well the DataDog Cluster Agent will choose a DataDog Agent to run the cluster check and you should start seeing RabbitMQ metrics populating into DataDog. You can check this by going into the Metrics Explorer in DataDog and searching for metrics starting with rabbitmq.

Conclusion
You can do this with any external service that you want to monitor directly with DataDog. A lot of integrations for managed services like AWS do not scrape data often (5-15 mins) and your use case may require data that is updated every 30 seconds which Cluster Checks are a good use-case for.
Now you can go and configure your Horizontal Pod Autoscaler with RabbitMQ metrics from DataDog.
Troubleshooting
Check Cluster Agent Status
You can run the Cluster Agent configcheck command from the command line to see if your check is configured properly.
Find the pod name of your cluster agent and run the following command:
$ kubectl exec datadog-cluster-agent-POD-NAME agent configcheck
=== rabbitmq cluster check ===
Configuration provider: file
Configuration source: file:/etc/datadog-agent/conf.d/rabbitmq.yaml
Instance ID: rabbitmq:123456789
password:
rabbitmq_api_url:
username:
Check Logs
You can also look through the logs to see if there are issues:
$ kubectl logs -f datadog-cluster-agent-POD-NAME